
You know that thing where recipe blogs will put 300 years of family history before just giving you the recipe? I hate it too. So lets get the obligatory introduction over with and get down to business.
I am learning data science from Introduction to Statistical Learning with Applications in Python (ISLP).
My lab work, completed exercises, and personal projects are on my GitHub
If you learn something new, please subscribe and share what you learned with a friend!
Now, let's learn about data science, prediction, and inference.
The Essence of Data Science is Finding f
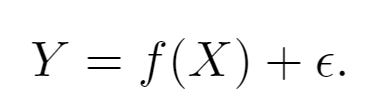
In the equation you see above:
X is your input variable, aka predictor, independent variables, features, or just variables.
Y is your output variable, aka response or dependent variable.
Epsilon, the little e looking thing on the end, is error. There is a reducible portion of error that exists because your f doesn't fit quite right. Then there is an irreducible portion of error that arises from numerous sources, but the most obvious is imperfect measurements of X and Y.
f is systematic information that X tells us about Y. The letter f is used because it stands for function.
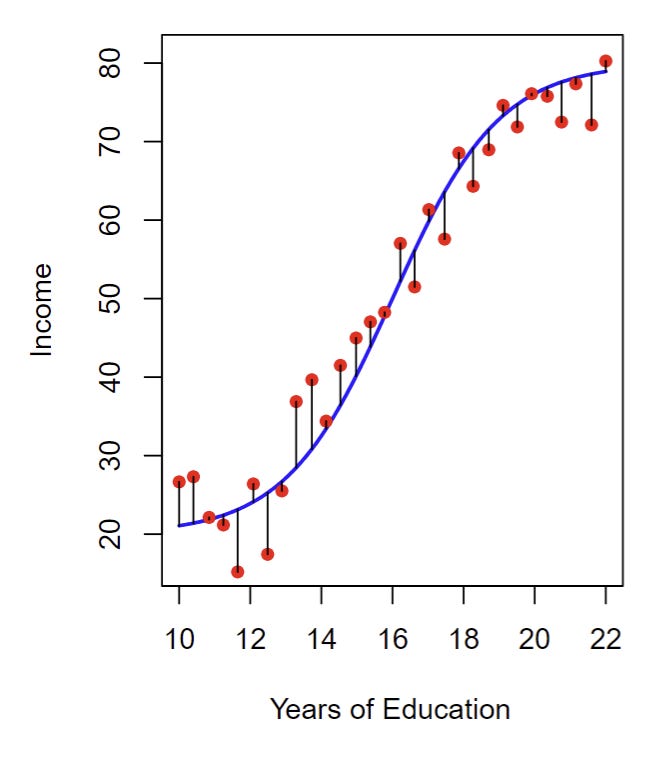
For the data shown in the plot above:
X is years of education.
Y is income.
The error is visualized by the little black lines that show the distance from your data points to
f, the trendline that estimates the relationship between a persons years of education and their income.
Knowing f allows you to perform prediction and inference.
Prediction
From a sample of the population you create a training set of X and Y, which is then used to approximate f. Now you can take a new X, it might be a different set of measurements or a hypothetical set of conditions, and predict the new Y.
When performing prediction, f can function as a black box. We aren't concerned with it's exact shape. In fact, with large training sets it is highly likely an f with strong prediction will be uninterpretable. It could be a Klein bottle with limitless portions of it beyond your sight and imagination, while the portion you can see is oddly mind-bending. But that doesn't matter. You successfully predicted Y.
An example of prediction is Large Language Models (LLMs) such as Chat-GPT. LLMs take in a prompt you write and then simply predict what letter should come next. There is no awareness of what it is saying or humanly interrogatable logic. The shape of f is inscrutable. But that doesn't matter, because it's prediction of the next letter writes out a statement that satisfies the user.
Inference
When performing inference, the shape of f is the answer. You are not trying to find an exact outcome of Y using f, you are trying to explain how X shapes Y through f. What predictors in X are associated with a desired response in Y? How does changing X affect Y? Can I accurately summarize f with a linear equation or is it more complicated?
Let's illustrate with an example. Say we are performing inference on a recipe. Within X we track ingredients, cooking methods, and presentation. For Y we measure the flavor of the food in categories like salty, sweet, bitter, etc. As we examine the shape of f, we make several surprising discoveries. Such as that the saltiness of the food is not just dictated by ingredients, but also by presentation temperature. As we continue to explore the relationship between temperature and taste we find saltiness is most intense at 85-95 degrees Fahrenheit, and food becomes less salty as it becomes hotter or colder! This makes sense, a frozen or burned tongue couldn't taste anything, much less saltiness. And such a relationship cannot be charted linearly, instead we must use something bell-shaped.
In Practice
The essence of data science is finding f, the relationship between predictors X and response Y. But finding f is not only dictated by the dataset, it also depends on your intent. Whether your goal is to use f to predict Y or infer the relationship between X & Y, you will need to make tradeoffs between accuracy and interpretability.